Original 工程的极限 Delta + E logo工程的极限ENGINEERING / LIMIT
Start a conversation ↗︎
ENGINEERING ANALYSIS · VISUAL COMMUNICATION

Complex systems.
Clearer decisions.

Airport safeguarding, catchment and drainage, separated networks and glare. Engineering analysis made visible.

01 / 04Jingjie above. Huijie below.
Jingjie · Airport safeguarding01—04 / MODEL STUDIES
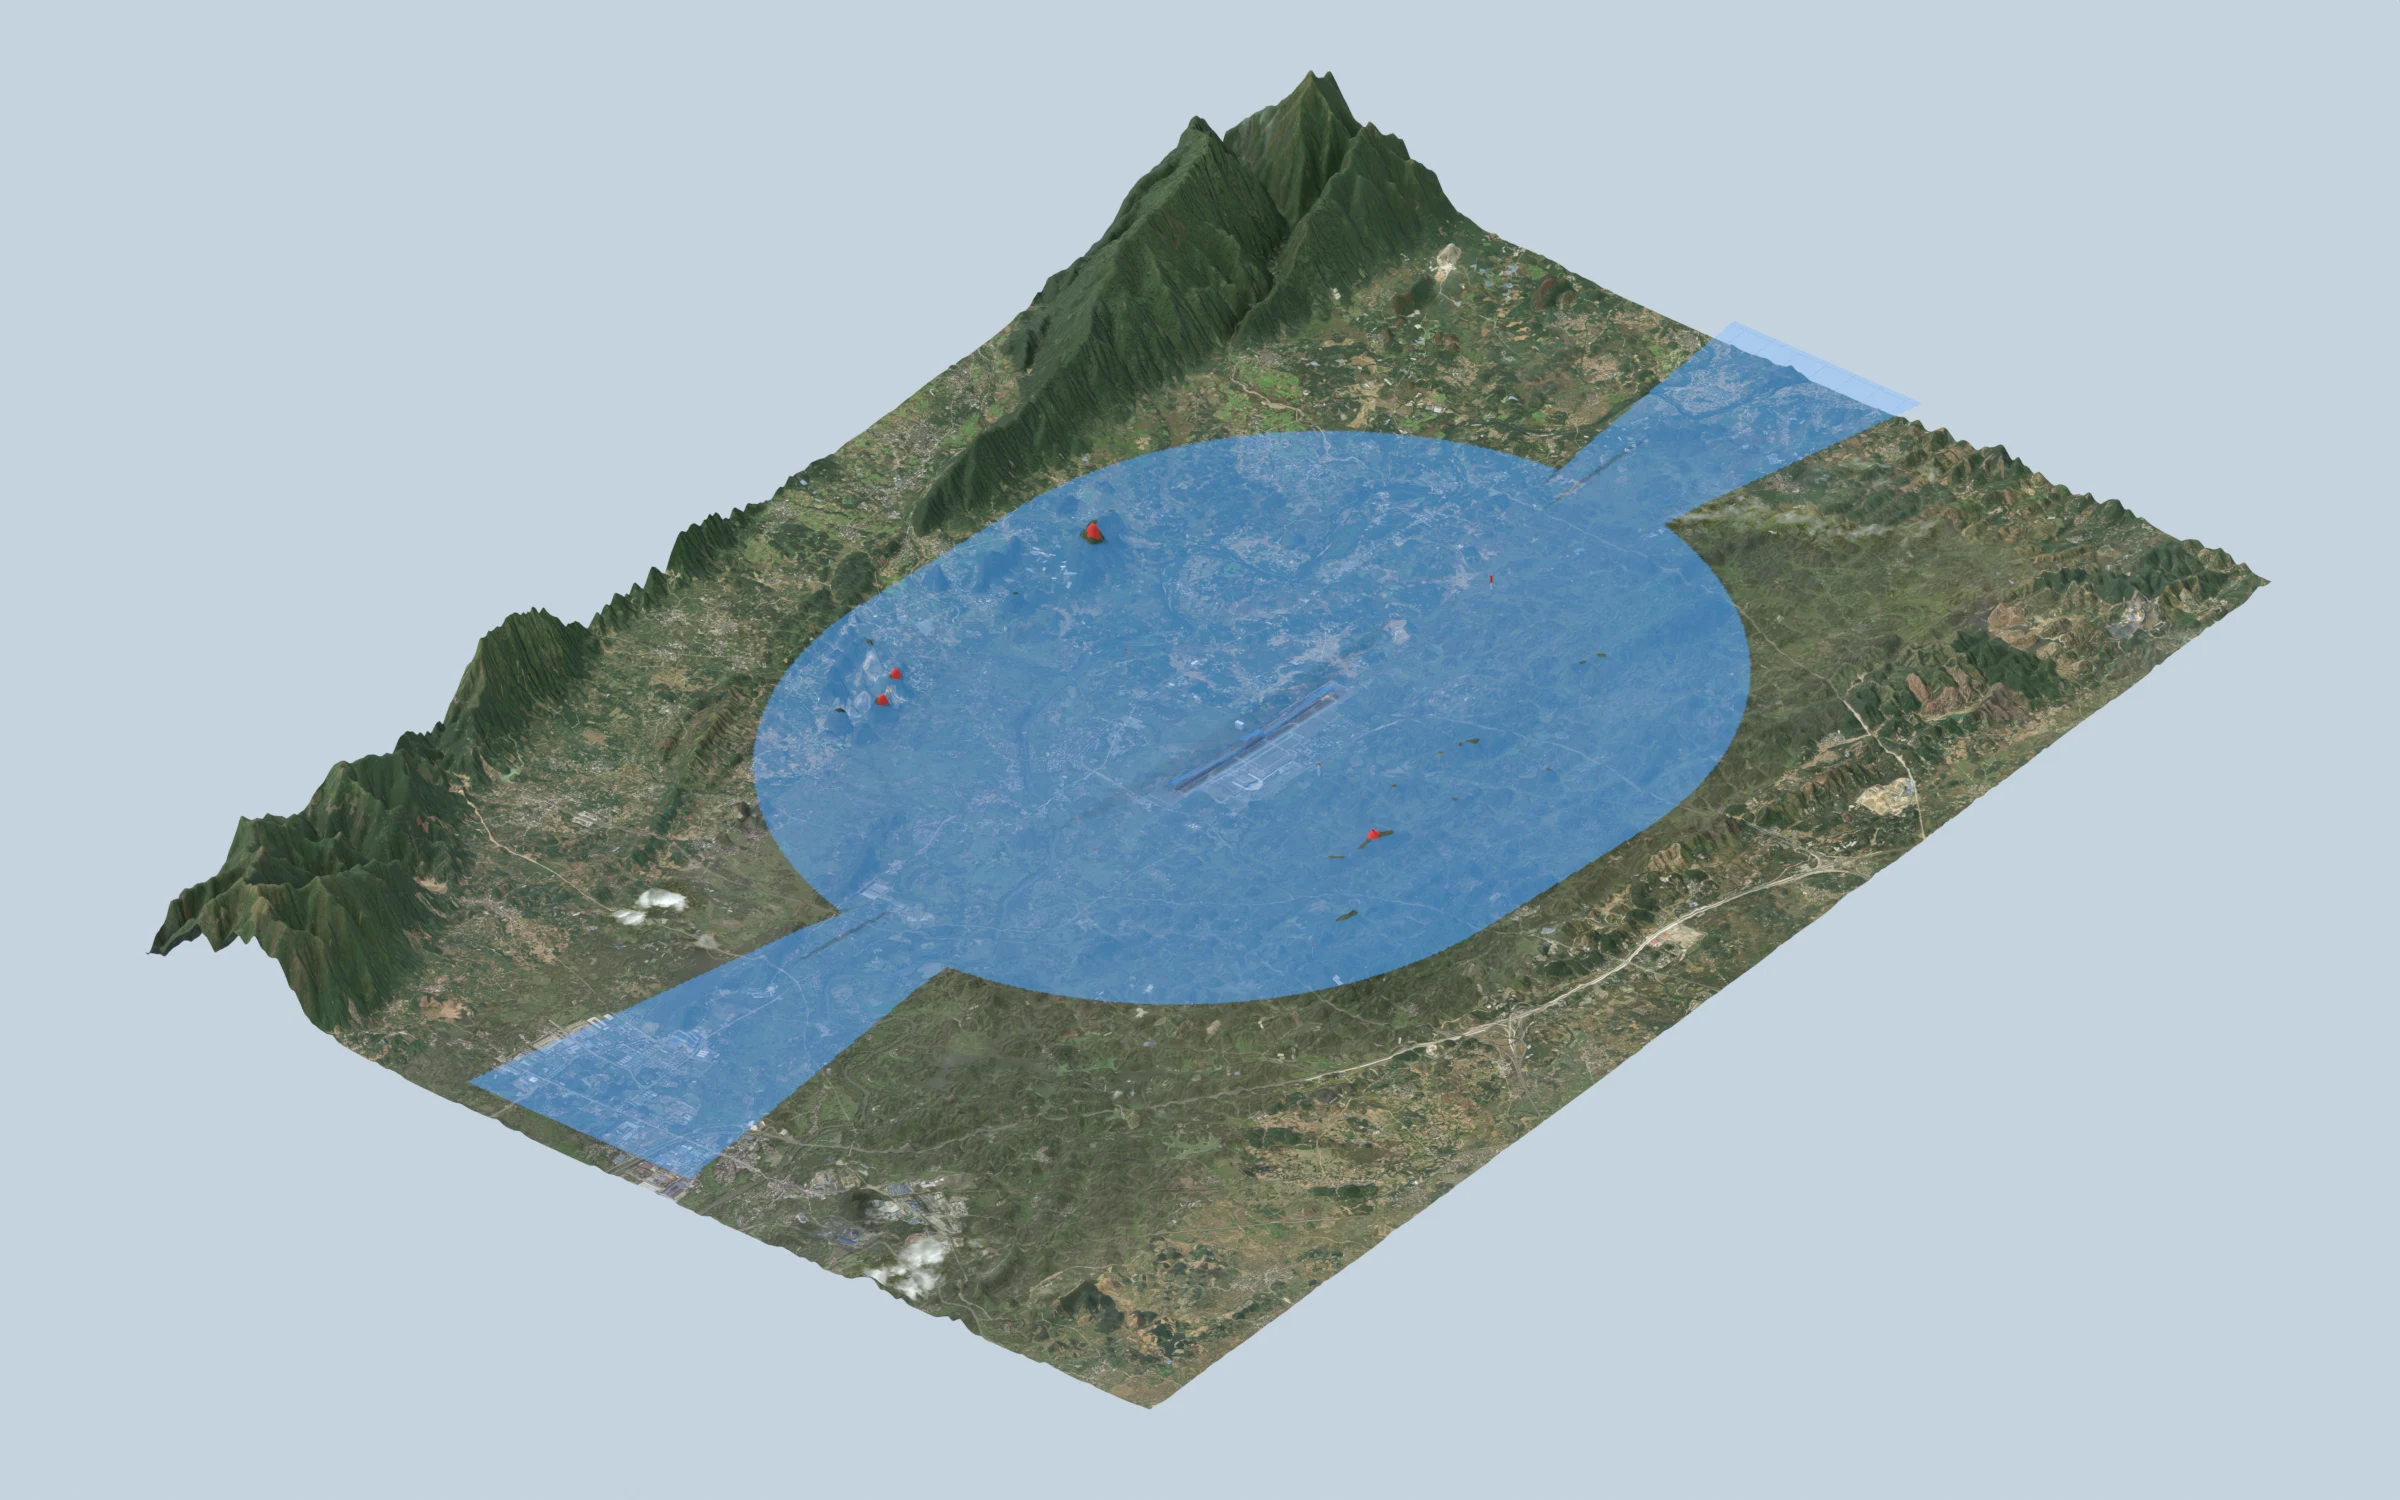
Jingjie 3D airport surfaces, terrain and obstacles
Airport surfaces and obstacle assessment↗︎
BUILT AROUND ENGINEERING QUESTIONSJingjie / Airport safeguardingHuijie / Catchments & airport drainageQingzhuo / Stormwater & wastewaterGlare / Reflection assessment
NEWJINGJIE V1.10.0 · FLAGSHIP DEMO

Click a mast.
Read both standards at once.

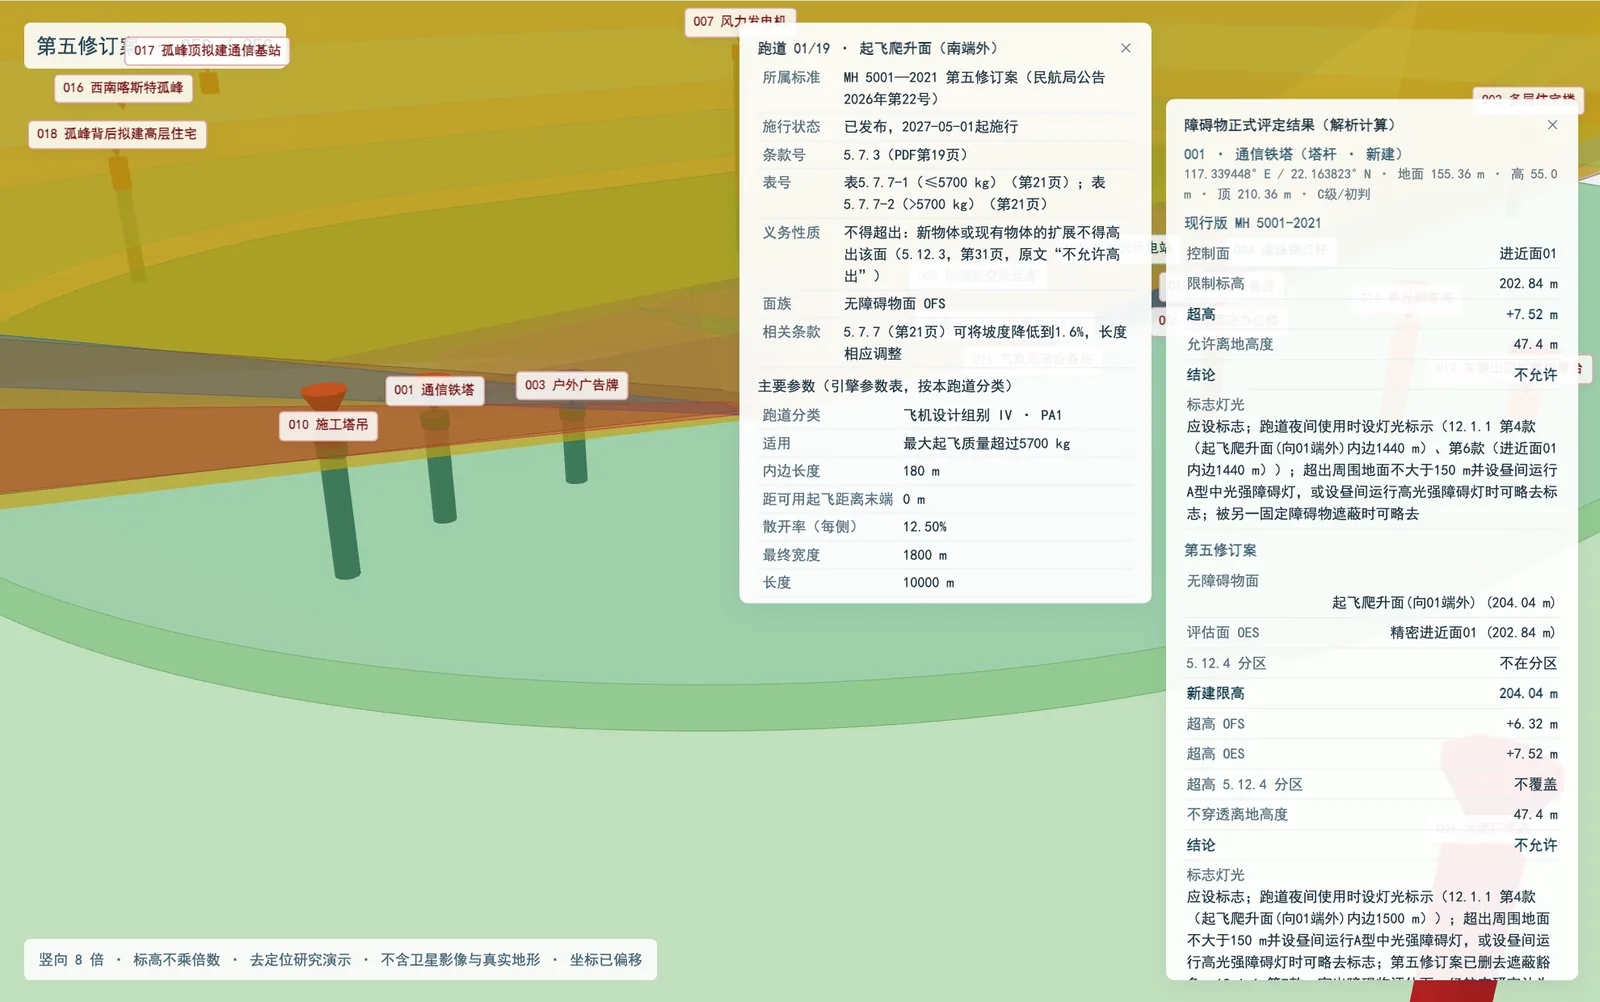
Nineteen obstacles stand in 3D with their assessed results. One click shows the controlling surface, limiting elevation, penetration and verdict under MH 5001-2021 and its Fifth Amendment. Click any surface for the clause number and the page in the standard; switch to difference mode to see where limits relax or tighten.

  • 38 analytic surfaces
  • 19 obstacles · two standards
  • 310,524-point difference grid
  • 38/38 clauses linked to pages

Research demonstration: no satellite imagery or real terrain; coordinates are offset. About 30 MB on first load; best on a desktop browser.

Jingjie V1.10.0 3D demo: a selected mast with assessment cards for both standards and the clause panel
BRAND FILM · 1:10

engineering,
to the limit.

Our name is our address: eng for engineering, limit for limit — 工程的极限, Engineering / Limit. One short film covers Jingjie, Huijie, Qingzhuo and glare analysis, the clearance chart set, the interactive 3D study and our Chinese, English and Japanese pages.

englimit.com
01OUR EXPERTISE

Above and below.
The complete picture.

3D modeling, process analysis, option comparison and project deliverables.

JINGJIE · INTERACTIVE STUDY

Explore the model. See the spatial limits.

No installation · Compare standards · Explore layers · Test a hypothetical object

Explore the 3D study
Explore the clearance chart set ↗︎
Jingjie · Airport safeguardingFILM · 1:44
Jingjie · Airport safeguarding

See the limits.
Understand the space.

Model airport safeguarding surfaces, terrain and obstacles together. Explore height constraints, spatial relationships and design options in a shared three-dimensional view.

  • Airport surfaces and obstacle assessment
  • Terrain penetration, height limits and marking review
  • Comparison of standards and 3D presentation
DELIVERABLESAssessment reports / Height-limit graphics / 3D models
Discuss airport safeguarding ↗︎
JINGJIE / CLEARANCE CHART SET

Jingjie · Clearance Chart Set

Civil aviation charts.
Directly from the model.

Starting from a parametric airport safeguarding model, generate protection-area charts, obstacle limitation surface charts for both the current standard and the fifth amendment, elevation-difference analyses and Type A obstacle-chart compilation bases. The set follows CAAC chart requirements and ICAO chart conventions, with parameter tables, obstacle calculation tables and GIS datasets. Change a parameter and the entire set updates from the same model.

07A0 / extended sheets
≈119 sper demonstration-airport run
03current / fifth amendment

From the runway vicinity to hundreds of square kilometres.

At the demonstration airport, the current obstacle limitation surfaces cover about 213.6 square kilometres. Under the fifth amendment, coverage including obstacle evaluation surfaces reaches about 469.8 square kilometres, or 2.2 times the current area. Hard obstacle-free surfaces cover about 25.5 square kilometres; most of the remaining coverage consists of evaluation surfaces, where penetration triggers an aeronautical study. Safeguarding charts now span hundreds of square kilometres, requiring a clear distinction between hard limits, evaluation triggers and the graded control zones in Clause 5.12.4.

Jingjie V1.9 · Precise vectors

Analytical solutions. Analytical lines.

The extent of every safeguarding surface and the controlling boundary between each pair of surfaces are derived directly from the standard’s parameters. Intersections between planes are straight lines; intersections between conical surfaces and planes are drawn as smooth curves to 1-metre accuracy. Straight lines remain straight in a PDF at 1,000× magnification. In DWG, every control zone consists of actual polylines and hatches that can be selected and measured for area. The calculations are unchanged: all 19 assessment results match when recalculated individually.
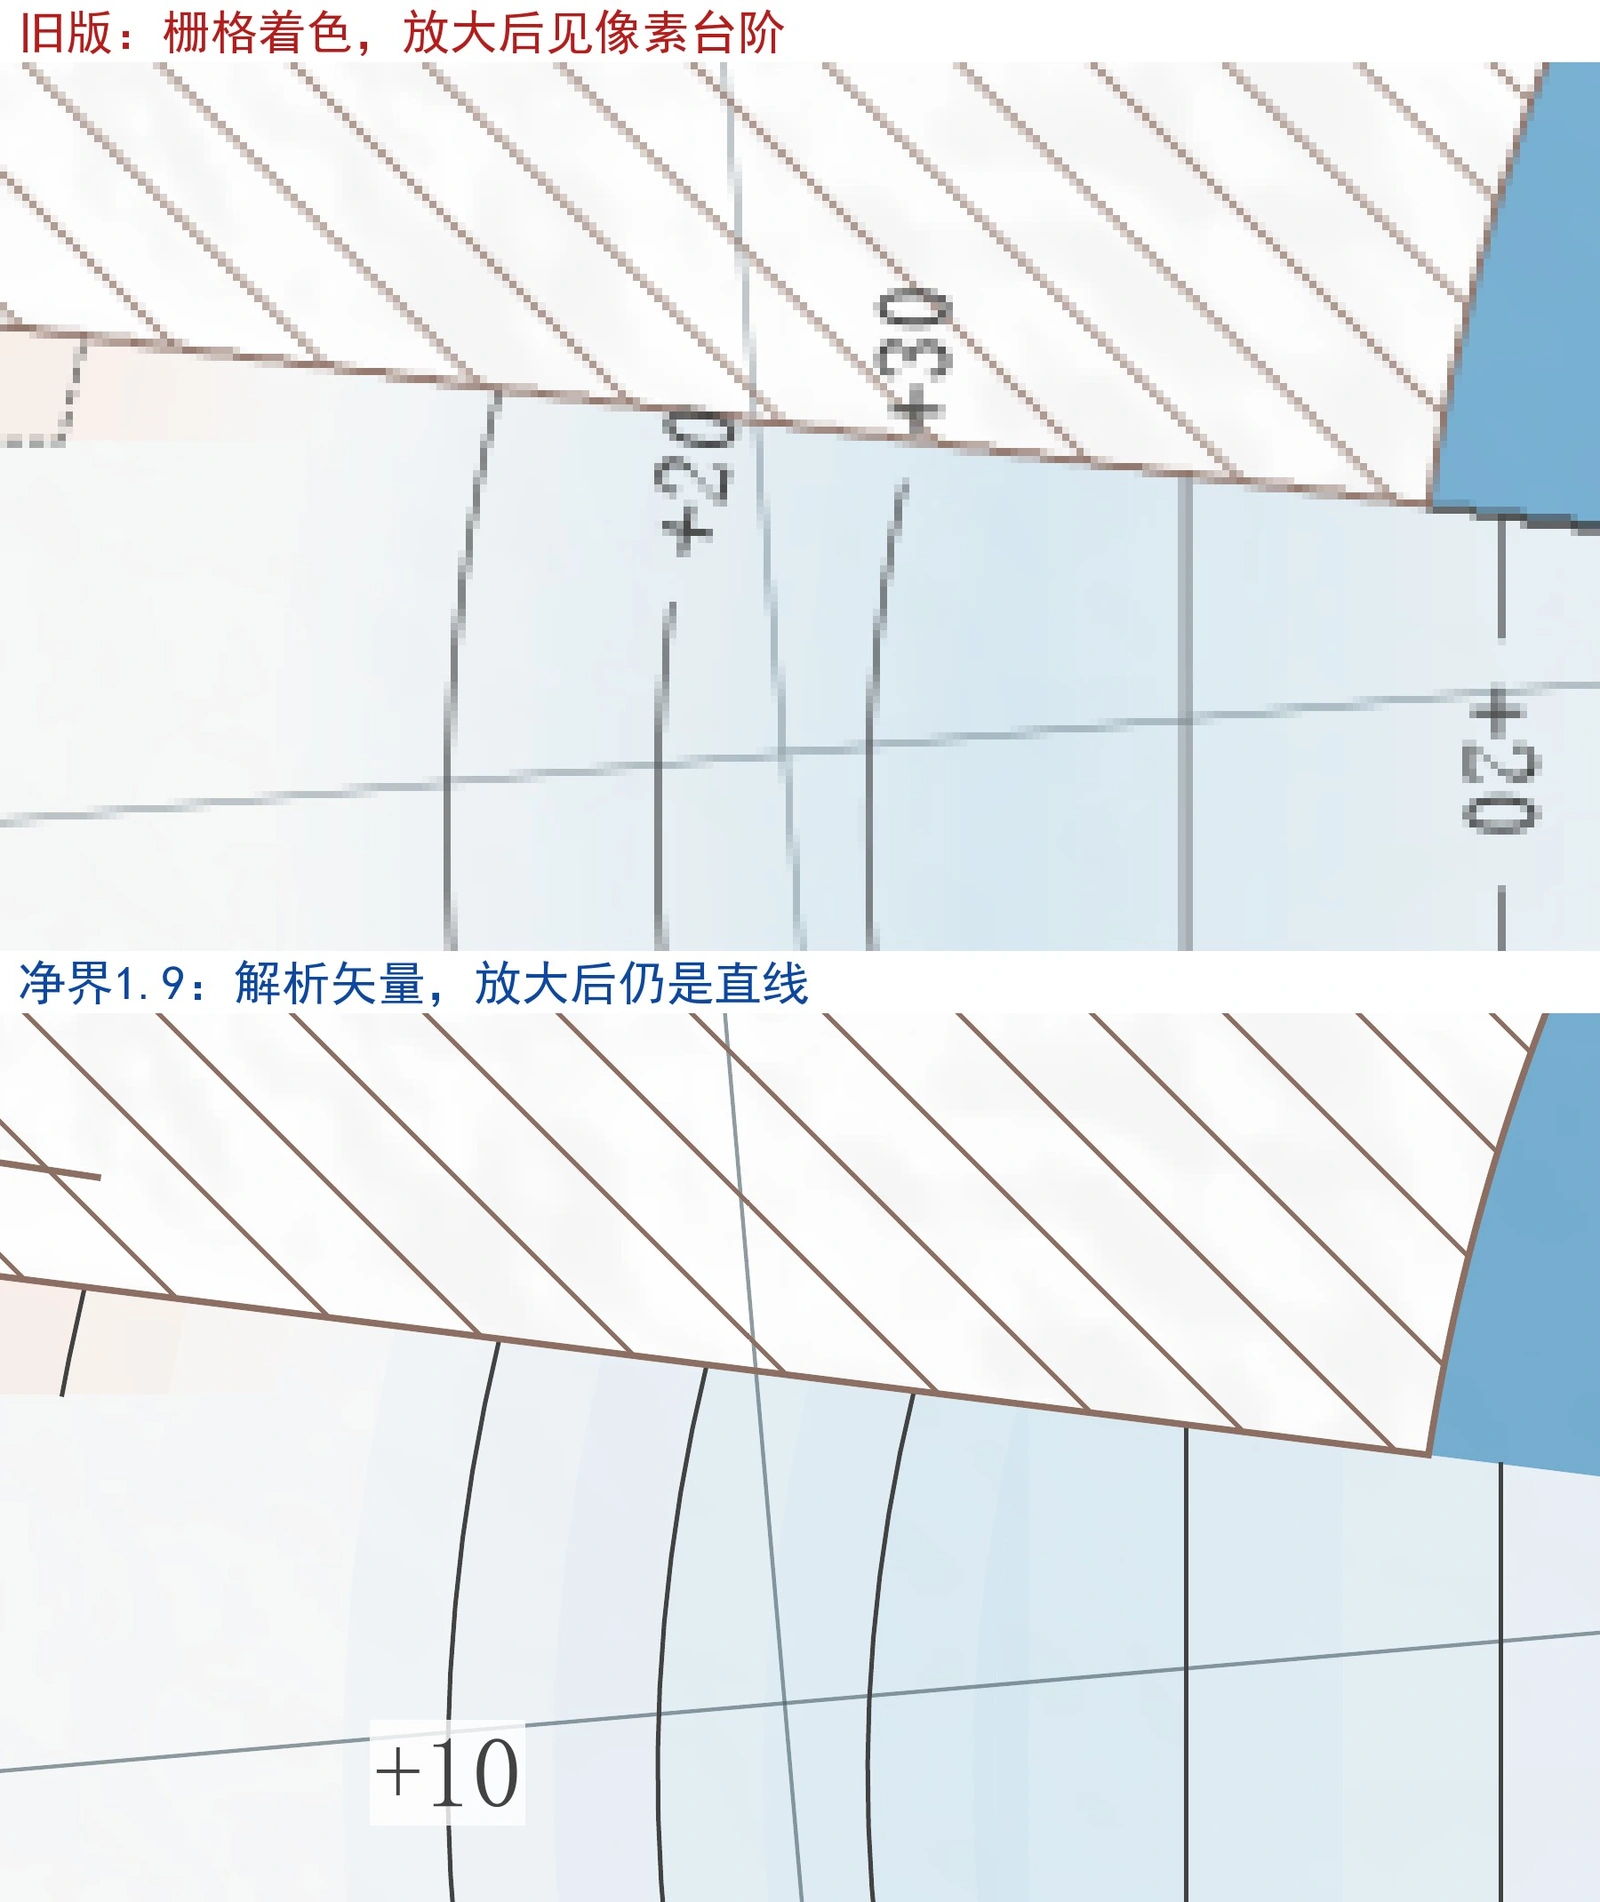
Precise-vector comparison: previous raster boundaries above, Jingjie V1.9 analytical vector boundaries below
Top: the previous raster shading shows pixel steps when enlarged. Bottom: Jingjie V1.9 analytical vectors retain straight lines. Labels in the image are in Chinese; select the image to view it larger.

Jingjie V1.12 · Chart update

Three separate volumes: current standard, fifth amendment and comparison. Cross-sections at both runway ends and the midpoint align with the plan.

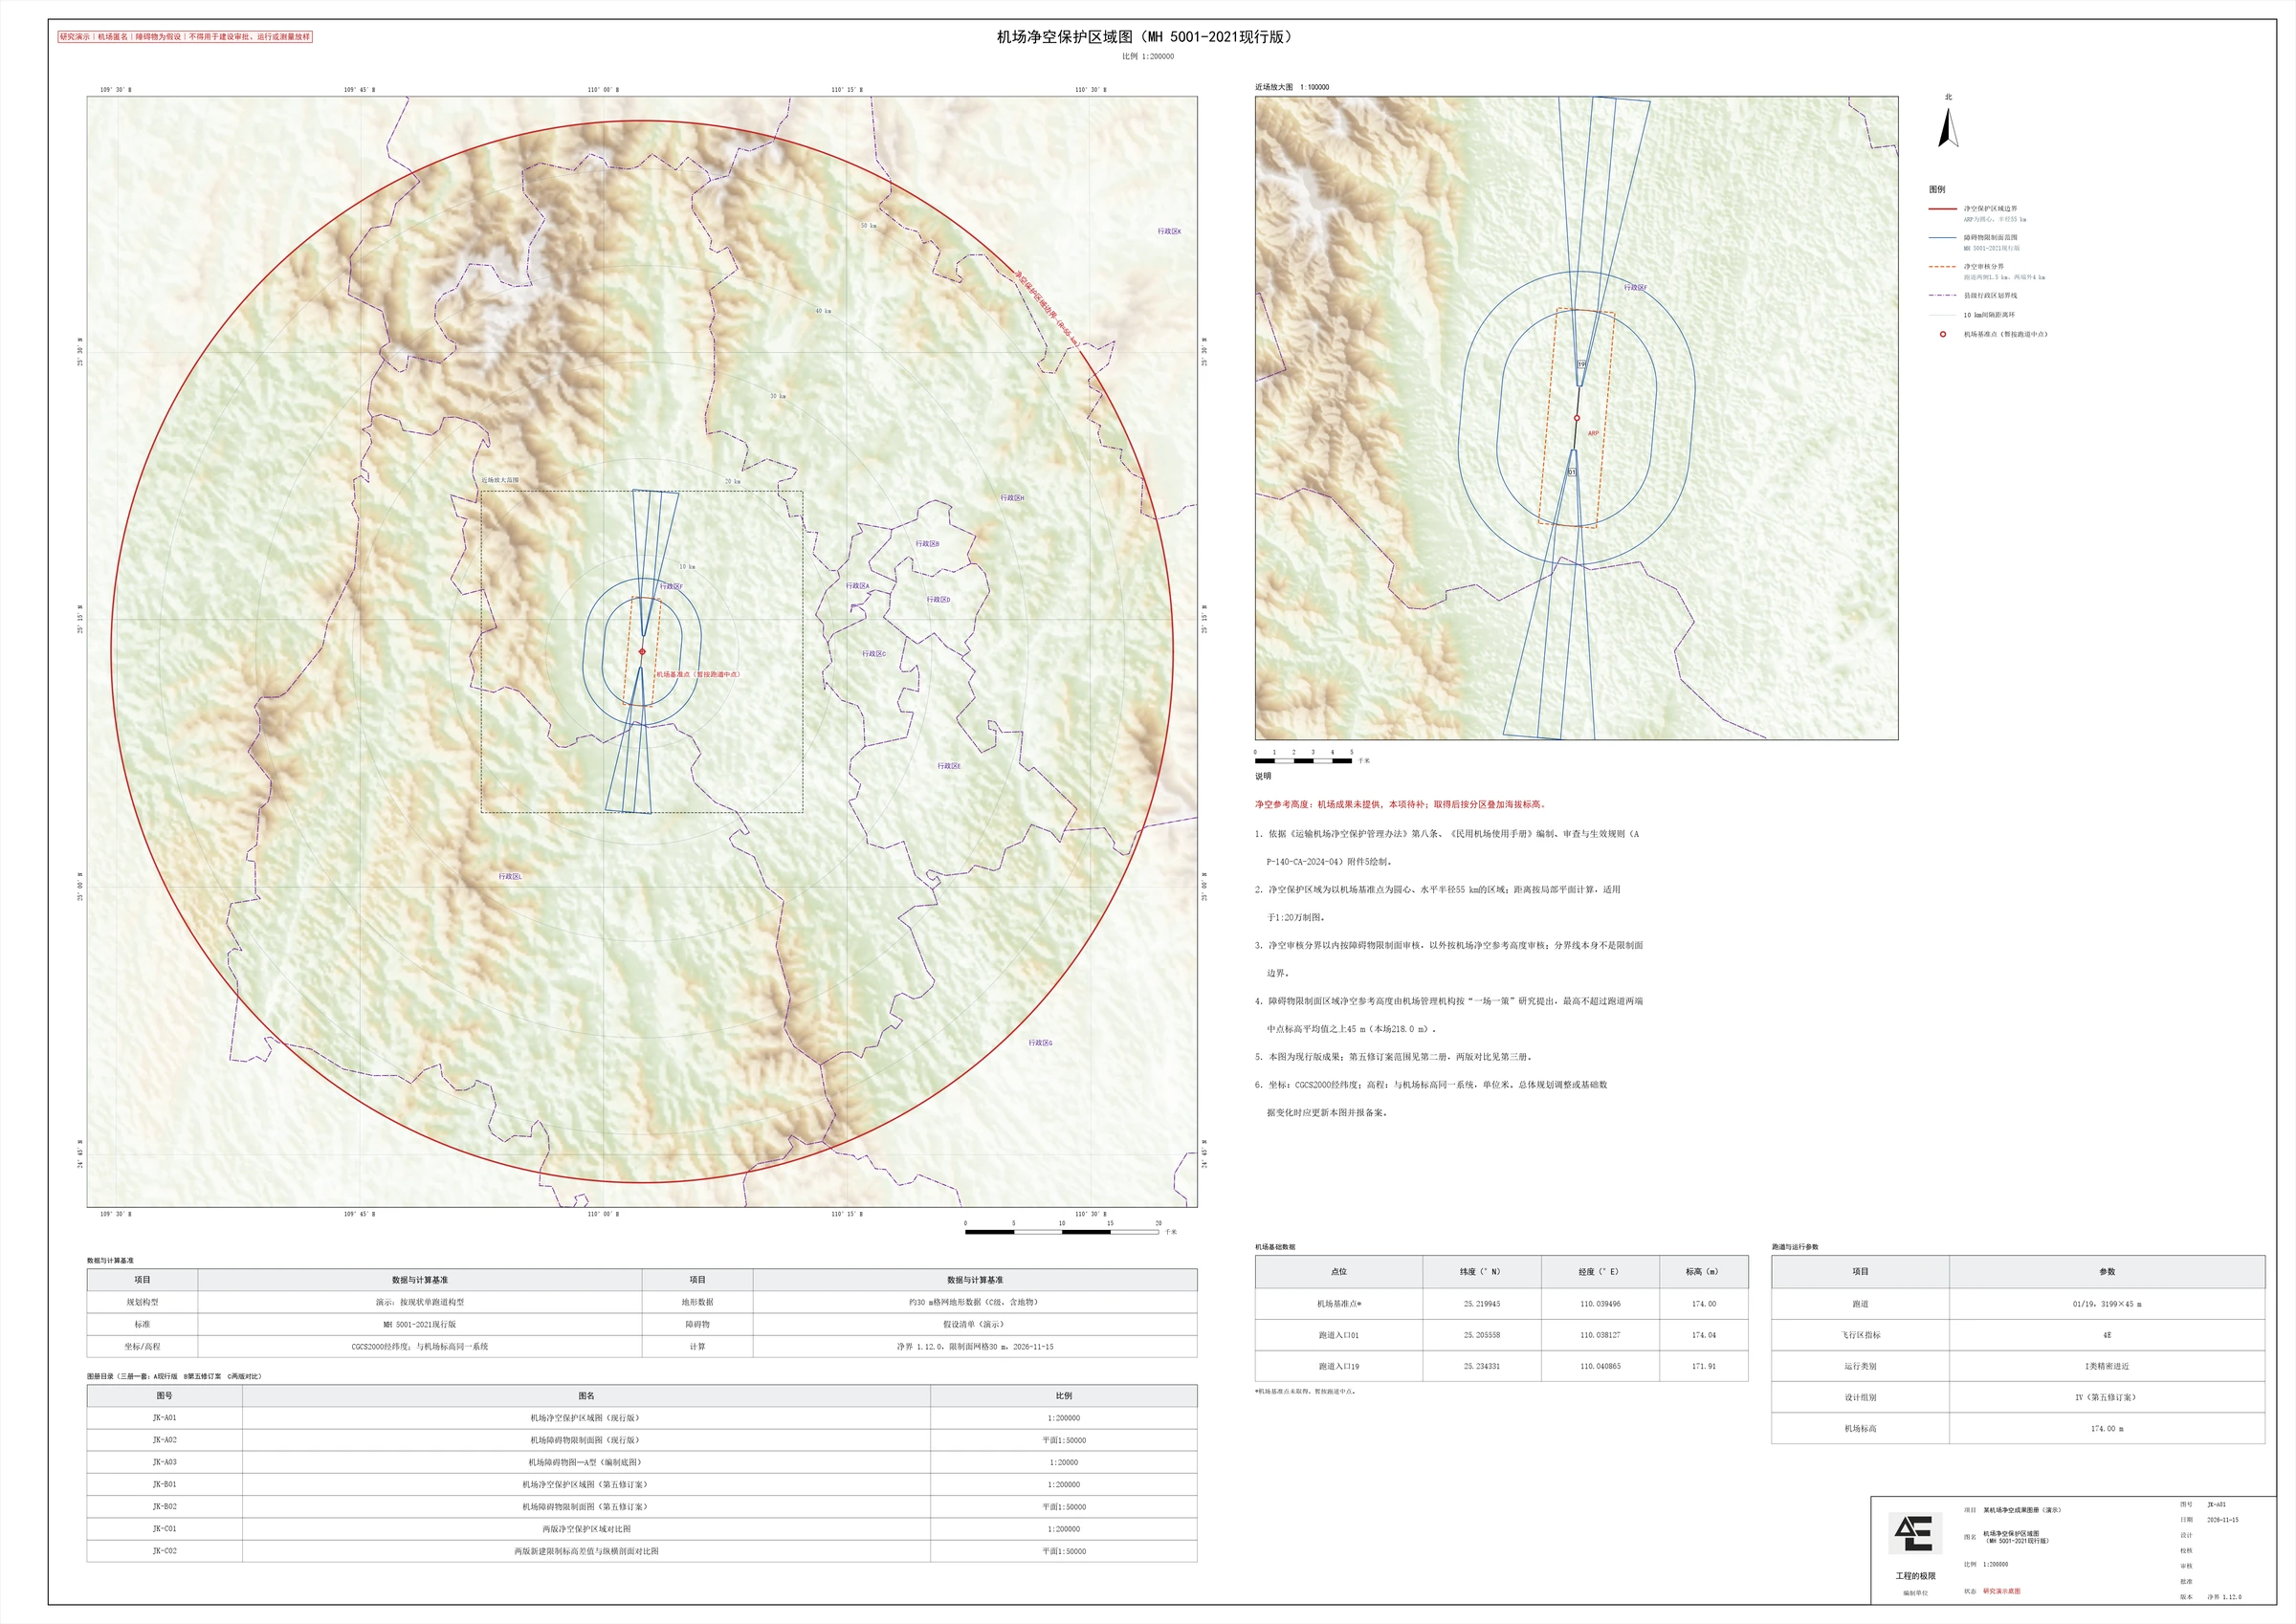
JK-A01 · Protection areas · current — Protection boundaries and reference heights
JK-A01 · Protection areas · current1:200000Protection boundaries and reference heights
01

Built to chart requirements

Article 8 of the Transport Airport Safeguarding Management Measures; Appendix 5 to the Rules for Compilation, Review and Entry into Force of the Aerodrome Manual (AP-140-CA-2024-04); and the Aerodrome Obstacle Chart — Type A (Operating Limitations) Compilation Specification (WM-TM-2019-02). Scale, title placement, minimum lettering height, administrative boundaries and safeguarding reference heights are addressed individually.

02

Two standards, distinct models

The current MH 5001-2021 standard and its fifth amendment, effective 1 May 2027, are modelled and charted separately, with an analysis of differences in elevation limits for new construction. Obstacle evaluation surfaces under the fifth amendment are shown separately and are not treated as height limits.

03

Aligned with ICAO conventions

The surface system corresponds to ICAO Annex 14; the Type A chart format corresponds to the Aerodrome Obstacle Chart — ICAO Type A in Annex 4, including take-off flight path areas, the 1.2% identification surface, obstacle shadows and significant obstacles.

04

Updates in seconds

The demonstration produced seven chart PDFs and DWGs, results tables and GIS data in about 119 seconds in one run; actual time depends on inputs and hardware.

Standard directory deliverables: the complete PDF set + editable DWG, with clearance results (Excel) and GIS datasets (GeoJSON / GeoTIFF / DXF).

STANDARD PDF + DWG

Jingjie V1.12 | Cross-sections and three-volume set

V1.12 · 05:07

Explore the new cross-sections, seven charts in three volumes and updated layouts. Chinese narration and captions.

Jingjie V1.9 | Clearance chart set demonstration

V1.9 · 07:39

Explore Jingjie V1.9, from the 3D clearance model to five deliverable charts. The video is narrated in Chinese, with Chinese captions.

This demonstration uses real terrain and hypothetical obstacles; the airport is anonymized. Formal charts must be based on airport survey results and reviewed and signed by an appropriately qualified design or consulting organization. The Type A chart is a compilation base for supplying source aeronautical information; official publication is the responsibility of the civil aviation aeronautical information service organization.

Jingjie above. Huijie below.

Discuss your chart requirements ↗︎
Precise-vector comparison: previous raster boundaries above, Jingjie V1.9 analytical vector boundaries below

02SELECTED WORK

Engineering,
seen through models.

Explore safeguarding surfaces, catchments, underground networks and reflected light.

03MAKING THE WORK LEGIBLE

Understand the analysis.
See what it means.

Models address the technical question. Drawings explain spatial relationships. Visual stories make the process clear for both specialists and project owners.

▱
01 / ANALYSIS

Technical analysis

Organize inputs, establish applicable methods, and compare options and sensitivities with a traceable analytical basis.

Inputs & scopeOption comparison
⌁
02 / VISUALIZATION

Spatial visualization

Place terrain, surfaces, networks and light paths in context to show where an issue starts and where its effects extend.

3D graphicsProcess animation
↗︎
03 / COMMUNICATION

Technical communication

From technical reports to focused explanations, tailor the presentation to support design discussions, reviews and project conversations.

Reports & drawingsFocused explainers
Δ + E

Engineering as our frame.
Clarity as the outcome.

↘
04HOW WE WORK

A good collaboration
starts with a question.

Start with the decision you need to make. Then define the data, methods and deliverables that will help you make it.

  1. 01

    Frame the question

    Project type, current stage, key questions and intended use.

  2. 02

    Agree the scope

    Data readiness, analytical boundaries, output formats and working arrangements.

  3. 03

    Analyze & review

    Build the analysis, compare alternatives and review key findings.

  4. 04

    Deliver & explain

    Present reports and graphics, explain the findings and identify next steps.

05LET’S TALK

What’s your next
engineering question?

Send a private inquiry or find us on WeChat. A clear brief is the first step toward useful collaboration.

WeChat contact QR code
WECHAT CONTACT工程的极限

Scan to open in WeChat.
Tap the code to enlarge.

Never publicly listedAuthorized admin access onlyLayered anti-abuse checks

Checking the private inquiry service…

Tell us about your projectPRIVATE INQUIRY
Used only to respond to this inquiry. Never publicly displayed.

Used only to respond to your inquiry, never displayed publicly. Notifications go only to the site operator. Please omit sensitive information.

Inquiry and visit data information ↗︎

WECHAT CONTACT

工程的极限

Full WeChat contact QR code

Recognize it in WeChat, or save the image and scan it from your album.

Open original QR image ↗︎

Open full-resolution image ↗︎
WeChatPrivate inquiry ↗︎